April 29, 2019
No matter where you are in the United States, some food in your kitchen probably started its life in Fresno, California.
How do you know? Vegetables, like every other product, follow a supply chain that moves it from where it’s grown to where it’s used. That supply chain can be tracked through data, and that data can paint a powerful picture of how food, water and energy move throughout the United States. The data illustrates how every corner of America is connected.
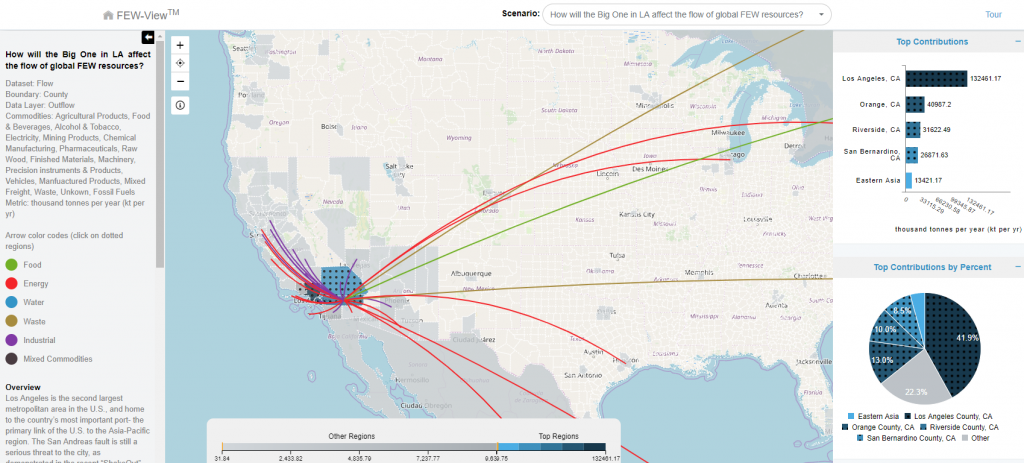
The FEWSION Project is the brainchild of data whisperer Ben Ruddell, an associate professor in the School of Informatics, Computing, and Cyber Systems (SICCS) at Northern Arizona University, who leads a multi-institution team of engineers and data scientists. FEWSION is a data fusion project that maps the food, energy and water supply chains for every community in the United States. Those maps are now available for public use through the FEW-View website, allowing people to see whether their gas prices could be affected by a Gulf Coast hurricane or how much New Englanders should worry about water shortages on the other side of the country. (Answers: Possibly and a lot.) This data was collected by hundreds of researchers at federal agencies and universities throughout the country and for the first time has been put into a searchable and visual form for anyone to use.
“This is a way to see that big data, to see your supply chains, see your lifelines,” Ruddell said. “We look at exposure. If you have a lot of exposure in your supply chain, there is a strong potential for you to be affected by a drought, storm or decision far away.”