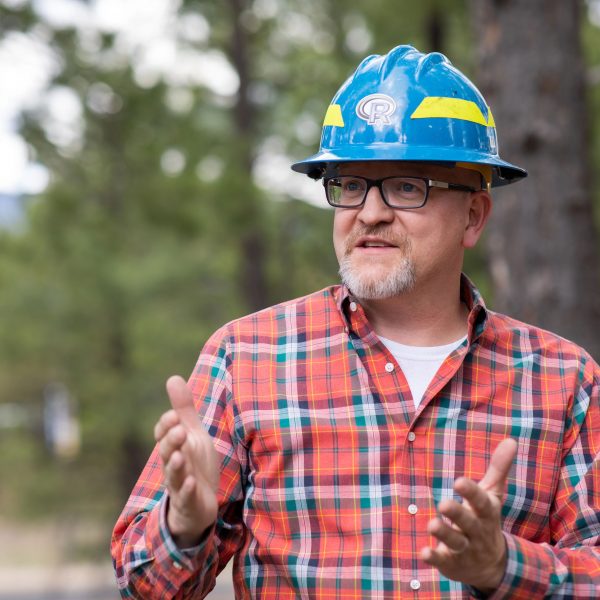
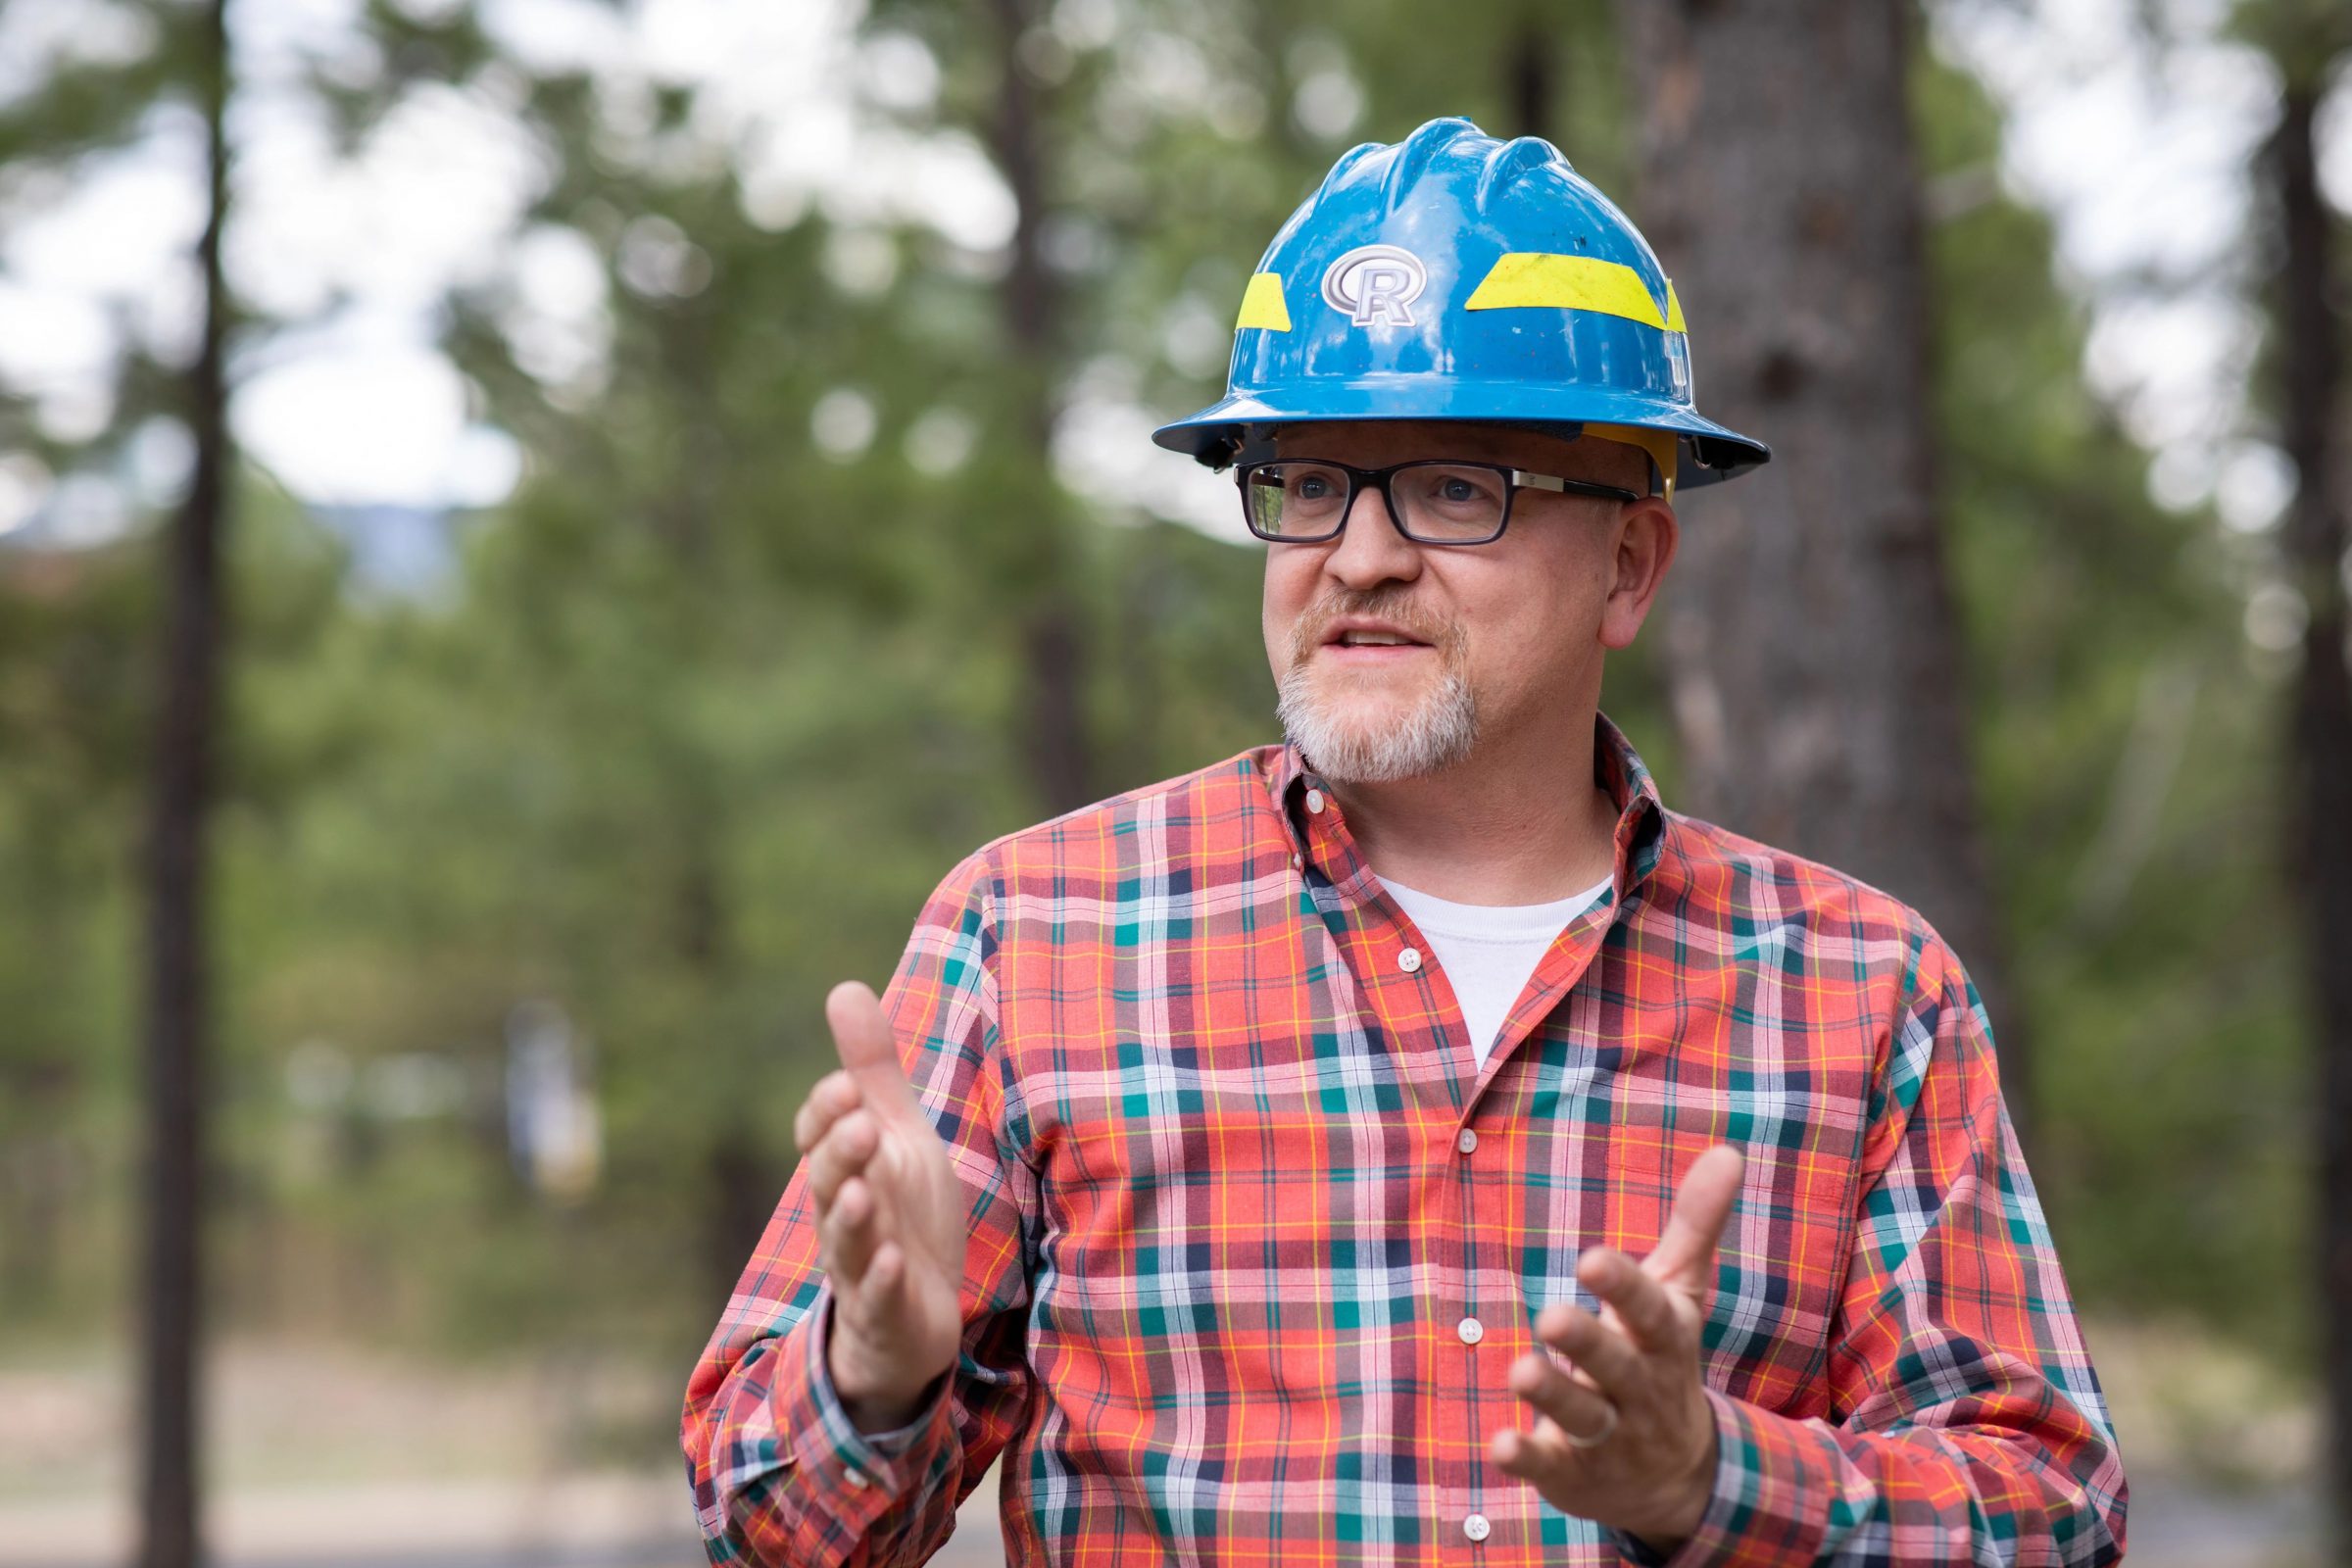
Using different teaching styles—and a touch of creativity—Dr. Andrew Sánchez Meador connects students with data analysis.
Visitors to Andrew Sánchez Meador’s office inside the Southwest Forest Science Complex can immediately see how he relates to his students—engaging, innovative, playful.
He adorns his door with dozens of cartoons and graphs that poke fun at the flaws and assumptions hidden in a stream of statistics, visuals, and academic jargon.
For example, you’ll find a bell curve labeled “normal distribution” above a bell-curve-shaped ghost labeled “paranormal distribution.”
The display is endless fun, and it’s completely by design, said Sánchez Meador, Associate Professor of Forest Biometrics and Quantitative Ecology and Executive Director of the Ecological Restoration Institute. He displays parodies that raise awareness of how we interpret research and present it effectively. In a similar way, the Data Visualization course he created brings in students from across scientific disciplines to learn to blend quantitative data and artistic presentation.
“I expect you to express some complex idea that is derived from data, but if I just gave you 15 pages of numbers, you’d never get there,” he said. “In the Data Vis world, we’d say ‘encode it’ into a visual metaphor that then can be consumed easily. If you think about it, that’s all that graphs are. If you stick to the rules and follow good design, you can make them pretty. You can make them say a lot more. You can have them tell a specific story.”
Sánchez Meador wants to help students who learn in unconventional ways feel capable. He loved graphic design and painting in high school but failed calculus. The math teacher told him to stick with art, which devastated him. Eventually, he went into biometrics, giving him the opportunity to marry his right- and left-brain interests—and gain a personal connection to students who often enter forestry because they want to interact with nature, not numbers. “My students come in with horrible math phobia,” he said. “They say the same thing about stats. They say, ‘I hate math; I’m not good at math.’ I say, ‘I’m horrible at math. But I’m really good at solving puzzles.’ I’ve found that bringing that level of humility—that approach to teaching students—really helps them get their feet in the right place so they’re standing on a good foundation.”
They say, ‘I hate math; I’m not good at math.’ I say, ‘I’m horrible at math. But I’m really good at solving puzzles.’
In an age of information glut, professionals must understand how to reliably create and read visual cues. Thus, the data visualization field is growing; new fields of study are cropping up; and cross-disciplinary paths are forming across art and design, mathematics and statistics, and journalism, Sánchez Meador said. He sees fertile ground for his research in his academic home of forestry, where NAU is regularly ranked a top-ten school.
Data visualization is not the only way that Sánchez Meador is welcoming to student needs.
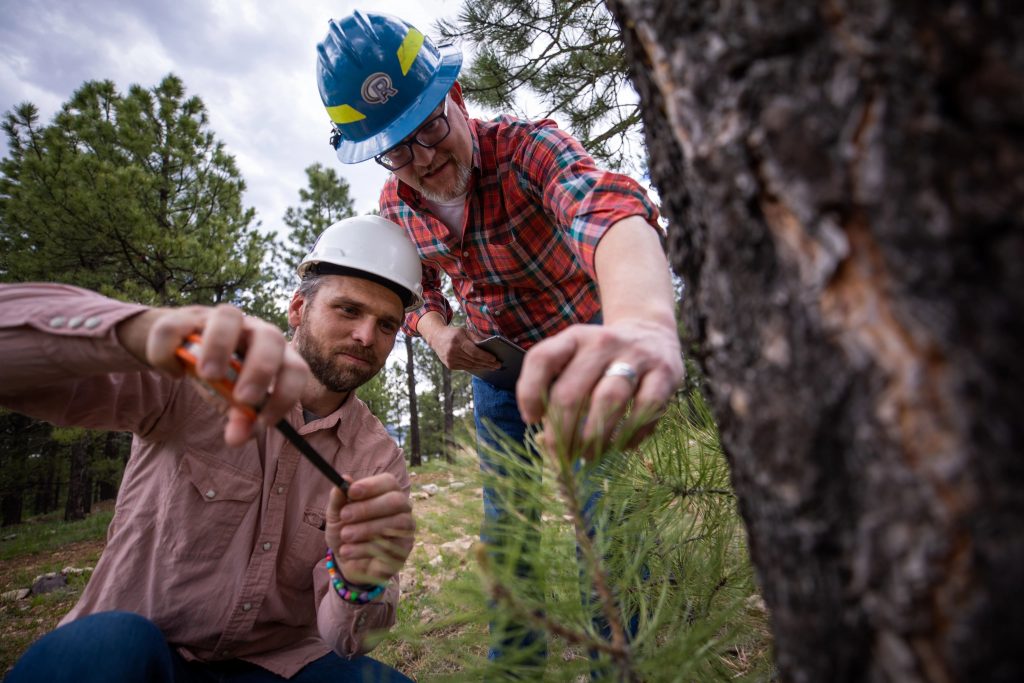
When students go out in the field, he arms them with tablets equipped with GPS and databases that allow them to efficiently make ecosystem assessments. This experience prepares them to succeed in their capstone course, which requires each School of Forestry major to write a management plan for a particular landscape.
Students also mimic fieldwork in the classroom when Sánchez Meador switches to “full-blown analog.” Using 12-by-18 plexiglass boards and miniature trees from model railroads, he has created models based on actual forests so students learn how to sample tree density.
“We could take three or four samples and work this up in one class period without ever leaving the building and do just as good of a job as if we had gone to the field and just done one sample,” he said. “It allows me to get more fieldwork and more hands-on experience in the classroom.”
Sánchez Meador sees a common theme among his various approaches. Whether using technology in the field, tactile learning in the classroom, or data visualization as a new way to see and share information, Sánchez Meador observes how students experience these different teaching styles to see what works for them. “If you just teach one way—here’s the formula, crunch the numbers—you didn’t reach a good portion of students in the classroom,” he said. “My idea is to try to do it repeatedly in as many ways as I can to ensure that I’m not missing somebody. I haven’t figured out a way to get them all, but I’m not settling for missing two-thirds of the class because their learning style wasn’t handled.”

UP NEXT...
I used to have the mindset that 'I wasn't smart enough to do science,' but instead of listening to that voice in my head, I chose to take on the major anyway. This major has taught me that I am smart, and I am capable. It has showed me that there is a lot more to explore, and I would even go as far to say that my experience in this program has made me a lifelong learner.Jenna Chaffeur, BS Geology, ’19
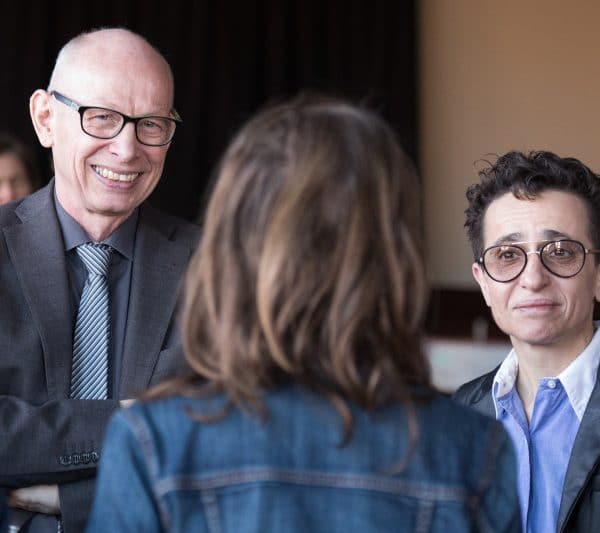
Experiences bring awareness
Regents’ Professor and Martin-Springer Institute Director Björn Krondorfer inspires his students with multi-layered learning.
We engineer a better world
At Northern Arizona University, the next generation of engineers is learning to design and build a safer, healthier, and more sustainable future.
A star researcher
Student-athlete Beau Prince, a Goldwater Scholar, is working toward a career in astrophysics.