
Course scheduling tools
Master planning: academic leadership
Considerations when building future course schedules should start with the Course Capacity Projections. Then, information gleaned from the following factors will help refine your schedule planning process:
- Increases or decreases in academic program enrollment.
- Increases or decreases in academic program retention.
- Increases or decreases in enrollment in courses serving students across campus and/or multiple majors (e.g. Foundation Courses, BIO 181, Liberal Studies Courses, etc.)
- Impacts of course level and meeting times related to course completion rates. This information is to be used in combination with your unit’s course completion rates (available in Tableau*). Please Note: Due to high demand on our infrastructure during peak times (9:00 AM – 4:00 PM), we will continue to ask units to schedule outside these peak hours as much as possible.
- One-time and external factors (e.g. pockets or influx of quick growth, spike in applications or enrollments in high-demand programs).
- Remaining consistent with the Provost’s Office minimum enrollment guidelines of 15 for undergraduate courses, 8 for graduate courses, and 10 for co-convened undergraduate/graduate courses — these guidelines apply to all non-individualized study classes with only limited exceptions.
Course schedule building and planning folders have been built in Business Objects for easier navigation.
All classes by term: This report displays non-canceled classes and related details by the selected term. The data returned includes college, division, unit, instructor, requirement designation, reserve capacity, class career, campus, session, facility usage and more. A screenshot has been provided to show you where a shortcut for the report is located in Business Objects.
Class enrollment with wait list summary: This report counts class enrollment for the prompted term and breaks down enrollment status codes and status reasons for each class, including wait list history information. A screenshot has been provided to show you where a shortcut for the report is located in Business Objects.
Macro course enrollment trends [also available in Tableau]: This report displays information for the selected terms’ enrollment events for the term, academic unit, career, and campus selected. Intended to assist users in managing enrollment caps and sections offerings. A screenshot has been provided to show you where a shortcut for the report is located in Business Objects.
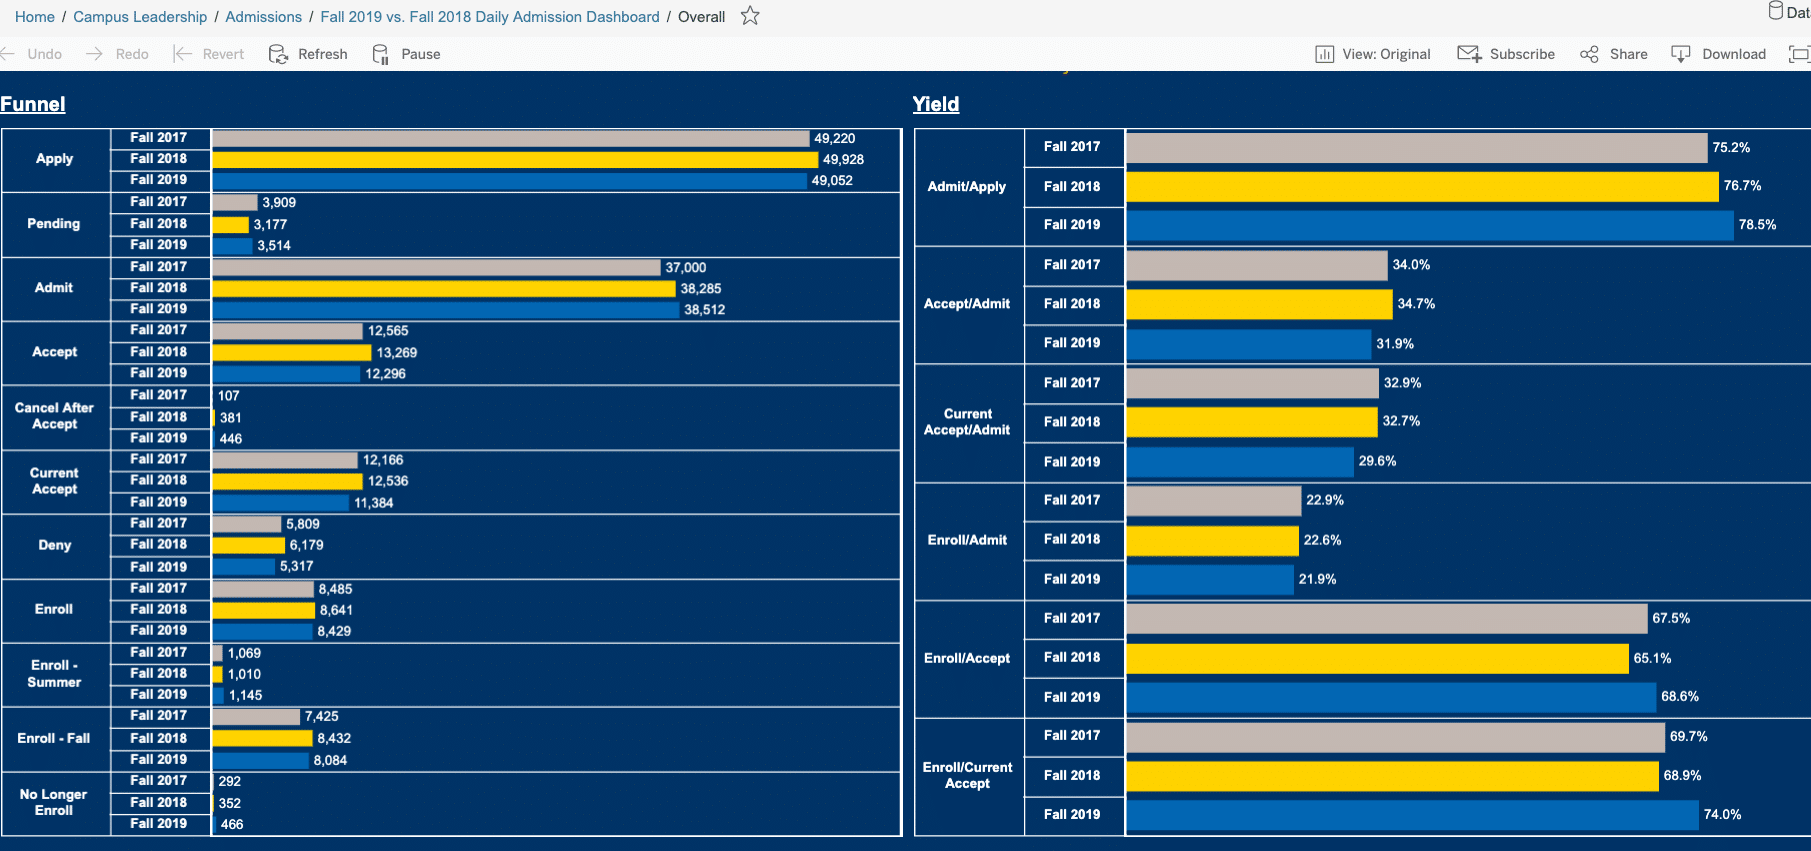
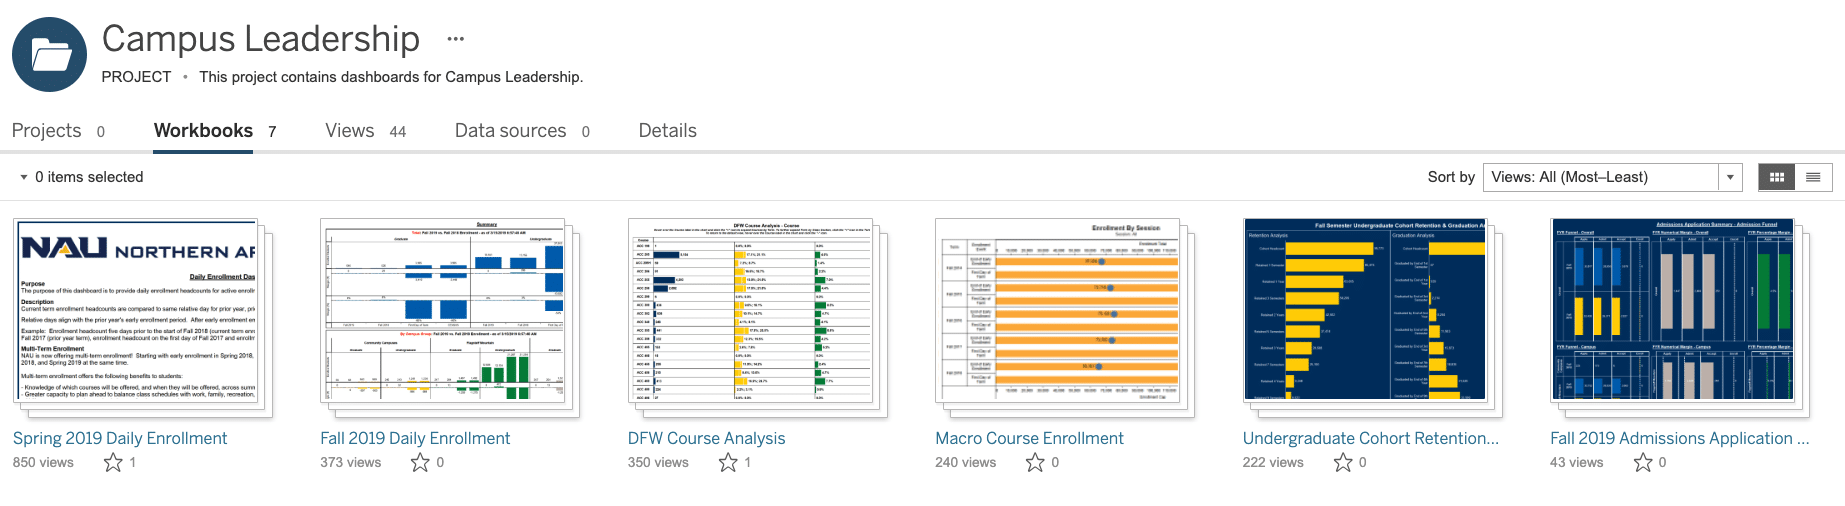
Application/Admission Dashboard: This dashboard provides a three-year comparison of all new applicants (undergraduate and graduate), from the application submission through enrollment. It can be drilled down to the degree program level. A screenshot has been provided to show users the look of the dashboard.
Undergraduate cohort retention and graduation analysis: This dashboard is intended to provide retention as well as graduation rates for all new undergraduate students assigned to a degree-seeking Fall cohort since 1994. A screenshot has been provided to show users the look of the dashboard.
Macro course enrollment trends: This dashboard provides information for course enrollments for Fall terms, starting with Fall 2014. A screenshot has been provided to show users the look of the dashboard.
Course completion data: This dashboard provides course level DFW and grade distribution information by academic college, academic division, term and respective class section. A screenshot has been provided to show users the look of the dashboard.
Early November
Utilizing the data and tools available above, identify all major and minor requirements for graduate and undergraduate programs, including certificates, for the fall, spring and winter terms two academic years into the future.
- Consider the approved and anticipated curricular changes and plan accordingly.
- Determine which term(s) these courses will be offered.
- Consider lists of major or minor requirements in which students have a choice, and determine a cycle of offerings based on current and past course schedules and enrollments.
- Consider courses that rotate on a multi-year basis (e.g. every other year, ever even year, etc.)
Mid-November
Utilizing the data and tools available above, identify all elective, service, and topics courses for graduate and undergraduate programs, including certificates, for the fall, spring and winter terms two academic years into the future.
- Consider anticipated curricular changes and plan accordingly.
- Consider lists of courses which students have a choice, and determine a cycle of offerings based on current and past course schedules and enrollments.
- Consider courses that your unit provides that satisfy institutional requirements such as: liberal studies, diversity, foundation requirements, etc.
Early December
Discuss this preliminary schedule with faculty and solidify adjustments before asking course schedulers in the units to start mapping and building the courses.
* University employees who need access to the Tableau dashboards to support their job junctions may obtain access by completing the following:
- NAU’s FERPA Online Training. If completed this training previously, it does not need to be completed again.
- NAU’s Tableau Data Usage and Access Online Training.
- Email Tableau@nau.edu to request access to the dashboards.
Course building: course schedulers
Please refer to Schedule of Classes maintenance on the Registrar’s Office website to access additional resources needed for your unit’s schedule build.